Resources
September 21, 2020
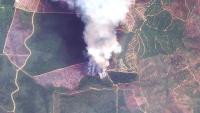
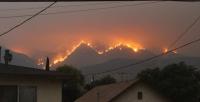
6 Graphics Explain the Climate Feedback Loop Fueling US Fires
![Bobcat Fire, as seen from Monrovia, California. Photo by Eddiem360/Wikimedia Commons](/sites/default/files/styles/150_tall/public/bobcat-fire-los-angeles-san-gabriel-mountains_0.jpg?itok=r9nMxNO4)
March 27, 2018
Power Plants Use Water, But We Have No Idea How Much
![](/sites/default/files/styles/150_tall/public/power_plant_2_0.jpg?itok=Go0WYt_q)
February 8, 2018
Visualizing a Warmer World: 10 Maps of Climate Vulnerability
![](/sites/default/files/styles/150_tall/public/irma_flooding.jpg?itok=Bg5f6Yv5)
January 24, 2018
Women and 3D Mock-Up
December 14, 2017
Places to Watch: 5 Forests at Risk This Month
![](/sites/default/files/styles/150_tall/public/places_to_watch.jpg?itok=AbUdebGj)
December 5, 2017
3 Ways Governments Can Prevent Fake Data on Forests
![](/sites/default/files/styles/150_tall/public/34342707721_93ee6e059c_o.jpg?itok=lzhHh8tS)
September 24, 2016